
Figure 5.
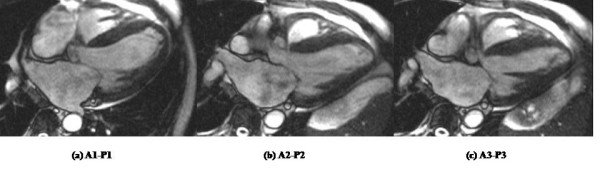
Images obtained of each scallop of the mitral valve. Each scallop of both mitral valve leaflets is clearly visualised: (a) A1-P1, (b) A2-P2, (c) A3-P3. Moderate centrally directed mitral regurgitation is seen most marked at (b) A2-P2 due to leaflet restriction following myocardial infarction.