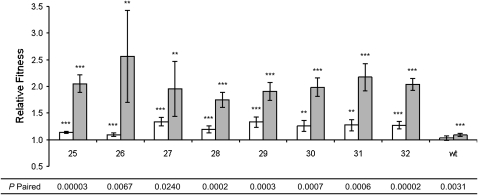
Figure 6.—
Relative fitness of populations from evolved UVR lineages of P. cichorii 302959 after 500 generations. Fitness values were measured in competition with the ancestor marked with pMRW2 under non-UVR (open bars) and UVR (shaded bars) conditions. Relative fitness values are means and error bars represent 95% confidence intervals. Values are significant (two-tailed independent t-test, μ = 1, d.f. = 5, α = 0.05) where indicated (*P < 0.05, **P < 0.01, ***P < 0.001). P-paired values are from two-tailed paired t-tests (d.f. = 5, α = 0.05) between non-UVR and UVR relative fitness values for each population.

