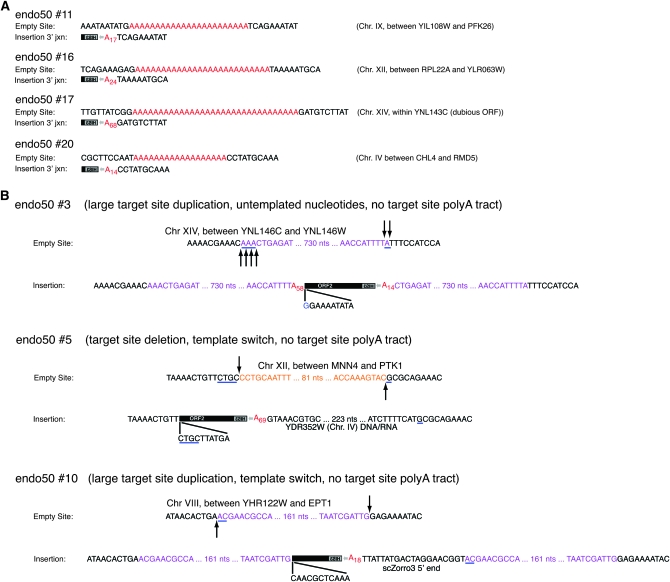
Figure 4.—
Characterization of scZorro3endo50 retrotransposition events. (A) Endo50 retrotransposition events at canonical Zorro3 target sites. 3′ junctions from each event were cloned and sequenced. Poly(A) tracts are highlighted in red and the subscript represents the average poly(A) length when multiple clones were sequenced. (B) Endo50 retrotransposition events at noncanonical target sites. 3′ and 5′ junctions for each event were cloned and sequenced. Purple nucleotides represent target-site duplications. Orange nucleotides represent target-site deletions. Underlined nucleotides indicate regions of temple switch microhomology. Bottom arrows and top arrows indicate possible sites of bottom and top strand cleavage, respectively.

