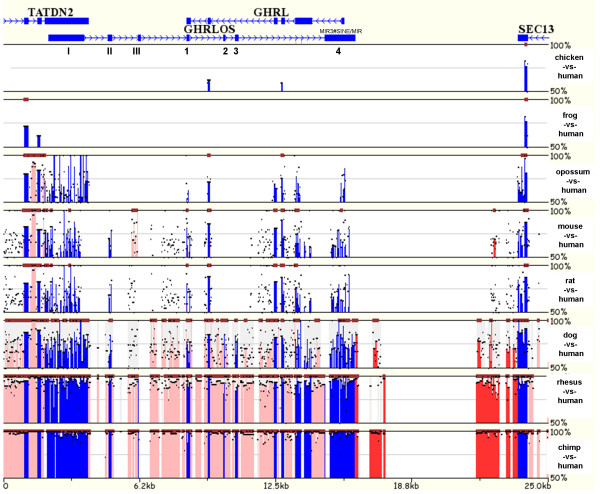
Figure 5.
Mulan sequence conservation profile for vertebrate GHRLOS loci. The horizontal axis displays the input sequence from human (UCSC hg18), chicken [UCSC galGal3], frog [UCSC xenTro2], opossum [UCSC monDom4], mouse [UCSC mm9], rat [UCSC rn4], dog [UCSC canFam2], rhesus macaque [UCSC rheMac2], and chimpanzee [UCSC PanTro2] GHRLOS loci. Evolutionary conserved regions (ECRs, > 70% identity; ≥ 99 bp) are depicted as dark red bars above each pairwise alignment. Exons (blue), intergenic elements (red) and intron sequence (pink) are marked and the vertical axis shows the percent similarity of vertebrate GHRLOS orthologues to the human sequence. GHRLOS exon numbers are shown. A transposable element in exon 4 (MIR3#SINE/MIR) is shown above exon 4.

