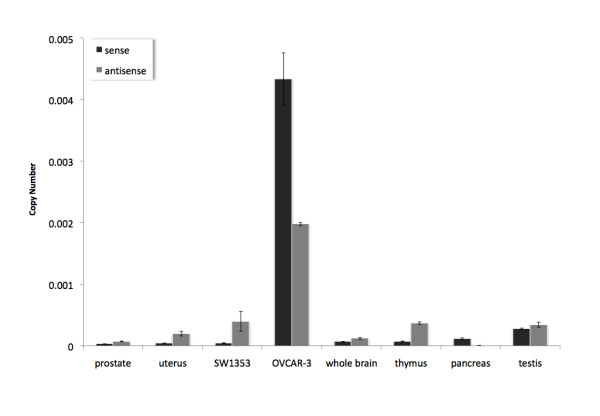
Figure 8.
Comparison of strand-specific GHRL and GHRLOS real-time RT-PCR. Relative total GHRL (sense, black) and GHRLOS (antisense, grey) RNA transcript expression levels in human tissues and cell lines. Calculations of RNA expression levels were performed using the standard curve method (correlating the threshold cycle number (CT values) and copy numbers of GHRL and GHRLOS) normalised to the expression of 18S ribosomal RNA. Each bar presents the mean ± standard deviation of duplicate reactions.

