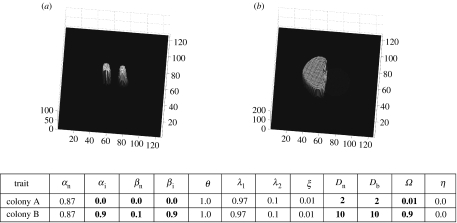
Figure 6.
Trait sets are the same as in figure 4 but colony B's inhibitor production (Ω) is 0.9. Note that colony A is deadlocked but occupies more space than in figure 5. Also, colony B does not engulf colony A and its biomass distribution is very small, as colony B has invested heavily in inhibitor production; (a,b) mycelial distributions at t=1 and 9, respectively.

