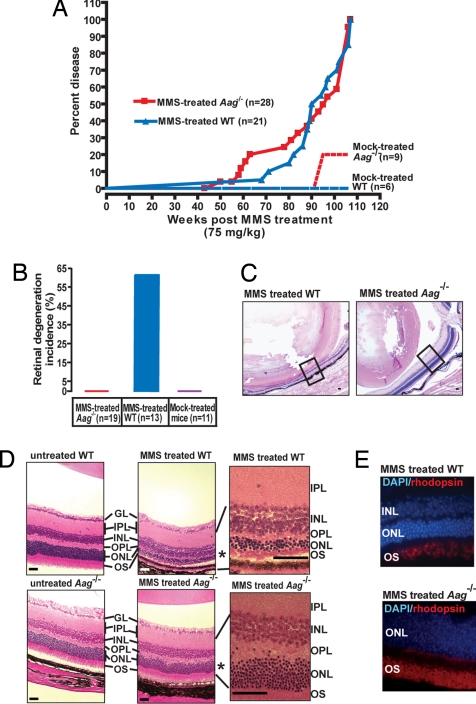
Fig. 1.
Aag−/− animals are protected from MMS-induced retinal degeneration. (A) Kaplan-Meyer plot of survival for Aag−/− (n = 28) and wild-type animals (n = 21) treated with a single i.p. injection of 75 mg/kg MMS or mock-treated (wild type, n = 6; Aag−/−, n = 9). (B) Increased incidence of retinal degeneration is seen only in wild-type-treated animals. Please note that good histological retinal samples were not obtained for all animals in the treated cohort, therefore the numbers of animals examined in B is lower than the total shown in A. (C) Photomicrograph comparing the striking retinal degeneration in a MMS-treated wild-type animal with the healthy retina seen in a MMS-treated Aag−/− animal. Box represents region in the retina that is shown magnified in D. (Magnification: 40×; bar: 1 mm.) (D) Photomicrographs depicting H&E-stained untreated retinas from adult wild-type and Aag−/− mice and retinas from MMS-treated wild-type and Aag−/− mice. (Magnification: 100×.) Region indicated by * is magnified 600× for detail. GL, ganglion cell layer; IPL, inner plexiform layer; INL, inner nuclear layer; OPL, outer plexiform layer; OS, outer segments. (E) Fluorescent staining of MMS-treated wild-type and Aag−/− retinas with DAPI (DNA stain = blue) and anti-rhodopsin antibody (rods = red). (Magnification: 600×.)

