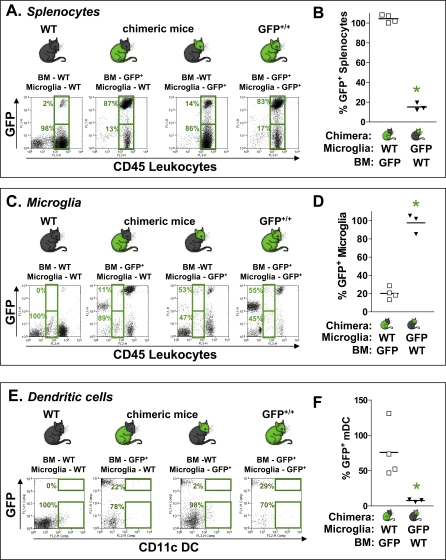
Figure 2. Tumor-Infiltrating DC Are Bone Marrow Derived.
(A–F) Bone marrow chimeric mice were used to assess the origin of CD11c+ mDC infiltrating into the tumor. (A,C,E) WT mice are depicted on the left panels; chimeras are as follows: WT mice adoptively transferred with GFP+/+ bone marrow; or GFP+/+ mice adoptively transferred with WT bone marrow; GFP+/+ mice are depicted on the right panels. GL26 cells were implanted in all mice 10 wk after irradiation and treated 17 d later with Ad-Flt3L and Ad-TK. 7 d after the treatment, tumor-infiltrating immune cells and splenocytes were isolated; flow cytometry was performed to detect total GFP+ splenocytes (A and B), GFP+ tumor-infiltrating microglia (C and D), or GFP+ tumor infiltrating mDC (E and F).
Representative dot plots show (A) GFP+ (upper boxes, GFP+, CD45hi) or GFP− splenocytes (lower boxes, GFP−, CD45hi); (C) GFP+ microglia (upper boxes, GFP+, CD45Int) or GFP− microglia (lower boxes, GFP−, CD45Int); and (E) GFP+ mDC (upper boxes, GFP+, CD11c+) or GFP− mDC (lower boxes, GFP−, CD11c+) infiltrating into the brain tumors.
The normalized percentage of GFP+ splenocytes (B), tumor-infiltrating GFP+ microglia (D), and tumor-infiltrating GFP+ mDC (F) are shown for each type of chimeric mouse (*, p < 0.05; Mann-Whitney U-test).

