
Figure 1. The anergic phenotype of CD4+ T cells from CTCL patients is not owing to an overall increase in CD4+CD25+ T cells.
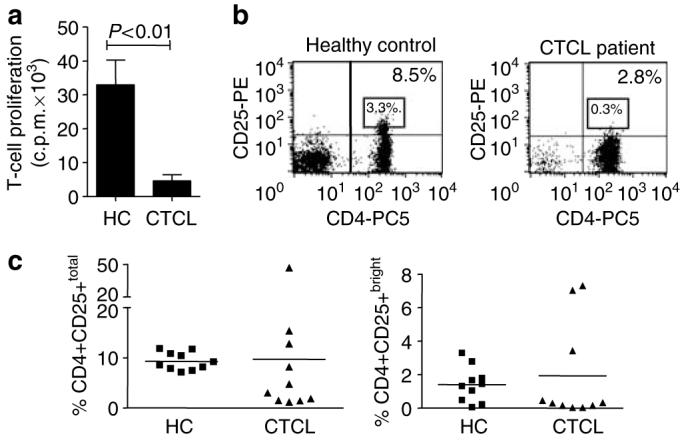
CD4+ T cells were isolated from PBMC of HC and CTCL patients via MACS. (a) CD4+ T cells were stimulated with anti-CD3 mAb (50 ng/ml) and APC, and T-cell proliferation was measured by 3H-thymidine incorporation. Data are depicted as mean c.p.m.±SEM, n = 10 independent experiments. (b) Representative dot plots of peripheral blood lymphocytes from HC versus a CTCL patient showing the percentage of CD4+CD25+total and CD4+CD25+bright T cells in CD4+ T cells; the square region indicates CD4+CD25bright T cells. (c) The percentages of CD4+CD25+total and CD4+CD25+bright T cells in the CD4+ T-cell fraction are shown for each individual HC and CTCL patient.