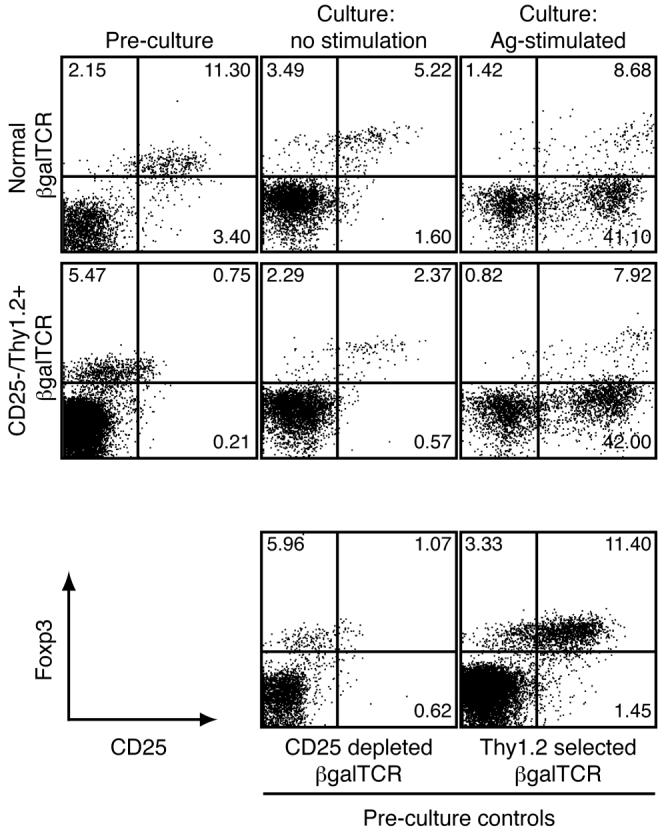
Figure 10.

Production of T cells with the Treg phenotype in Ag-stimulated cultures. Normal and selected βgalTCR T cells were analyzed for CD25+Foxp3+ cells prior to culturing and after 48 h in culture with or without Ag. FACS plots are gated on CD4+ lymphocytes.
