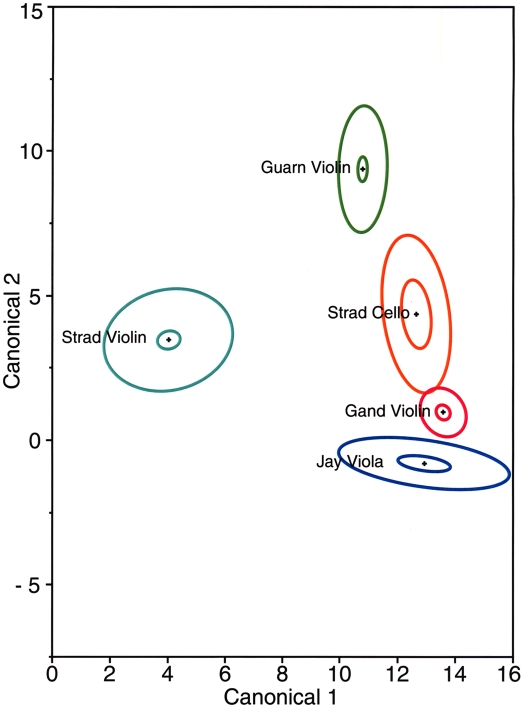
Figure 7. Canonical plot of musical instruments.
The results of discriminant analysis are shown for the violin and cello of Stradivari, the early period Guarneri violin, the violin of Gand-Bernardel and the viola of Jay. The small ellipses represent the area of 95% confidence; the large ellipses contain 50% of the measurements.

