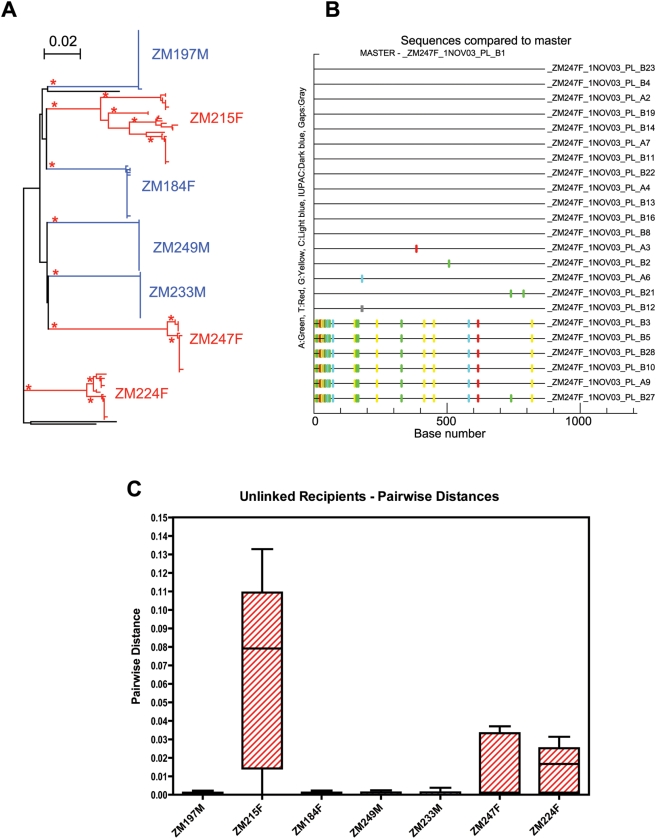
Figure 4. Analysis of unlinked recipients.
(A) Aligned nucleotide sequences for 8 unlinked recipients were used to generate a neighbor-joining phylogenetic tree. Horizontal branch lengths are drawn to scale, with scale bar representing 2% divergence. Lines drawn in blue indicate individuals infected by a single variant, those in red indicate infection by multiple variants. Asterisks indicate branches with bootstrap values greater than 0.95. Black lines indicate unrelated reference sequences. (B) Aligned linked recipient sequences were analyzed by the Highlighter tool (Los Alamos National Laboratory website - HIV Sequence Database), an example of the output file is shown for ZM247F. Tic marks indicate nucleotide differences from the indicated master sequences derived from the recipient. Nucleotide differences are color-coded and are marked according to their genetic location along the length of V1–V4. Colors are as follows: A: green, T: red, G: yellow, C: blue and gaps: gray. (C) Box plots were generated using the pairwise distances calculated for individual unlinked recipients. Horizontal lines within box plots indicate median pairwise distance values for each unlinked recipient. Red boxes indicate individuals infected by multiple genetic variants.

