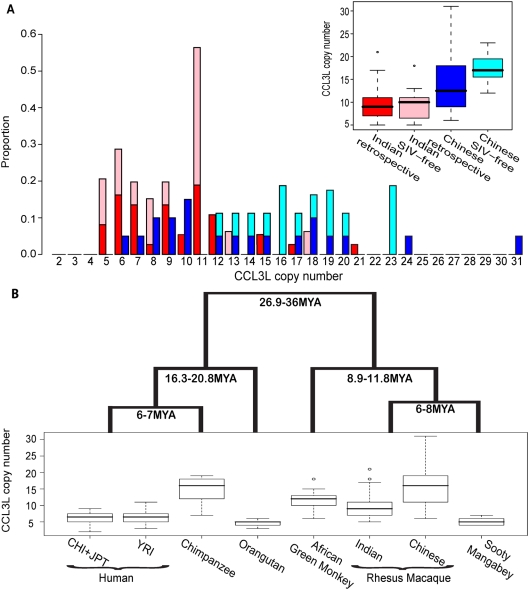
Figure 4. Population and species level copy number variation.
(A) Histograms and boxplots of CCL3L copy number distribution among the n = 57 animals used in the retrospective study as well as for a sample SIV-free Indian-origin (n = 16) and Chinese-origin rhesus macaques (n = 15). Red and light-red bars indicate Indian origin for the SIV and SIV-free populations, and blue and light-blue bars indicate the analogous for Chinese-origin animals. B) Box plot of copy number variation for 6 primate species: Human, Chimpanzee (Pan troglodytes), Orangutan (Pongo pygmaeus), Rhesus macaque (Macaca mulatta), African green monkey (Cercocebus aethiops), and Sooty mangabey (Chlorocebus atys). Whiskers indicate the upper and lower quartile with dots showing outliers. Estimates of species divergence times are from reference [37].

