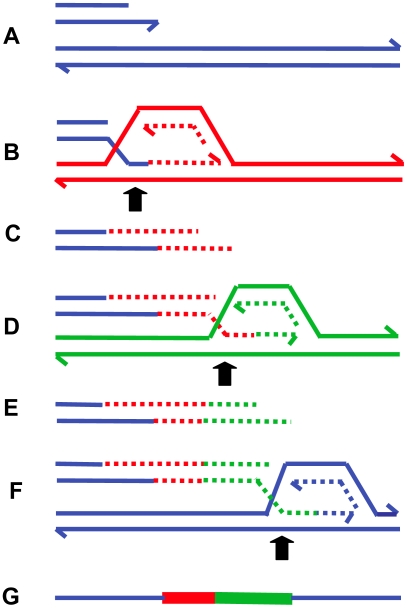
Figure 5. MMBIR.
The figure shows successive switches to different genomic positions (distinguished by color) forming microhomology junctions (arrows). For clarity, the nature of the single-stranded regions of annealing is not defined (see text). (A) shows the broken arm of a collapsed replication fork, which forms a new low-processivity fork as shown at (B). The extended end dissociates repeatedly ((C and E) shown with 5′-ends resected) and reforms the fork on different templates (D and F). In (F), the switch returns to the original sister chromatid (blue), forming a processive replication fork that completes replication. (G) shows the final product containing sequence from different genomic regions. Each line represents a DNA nucleotide chain (strand). Polarity is indicated by half arrows on 3′ end. Whether the return to the sister chromatid occurs in front of or behind the position of the original collapse determines whether there is a deletion or duplication (see Table 2).

