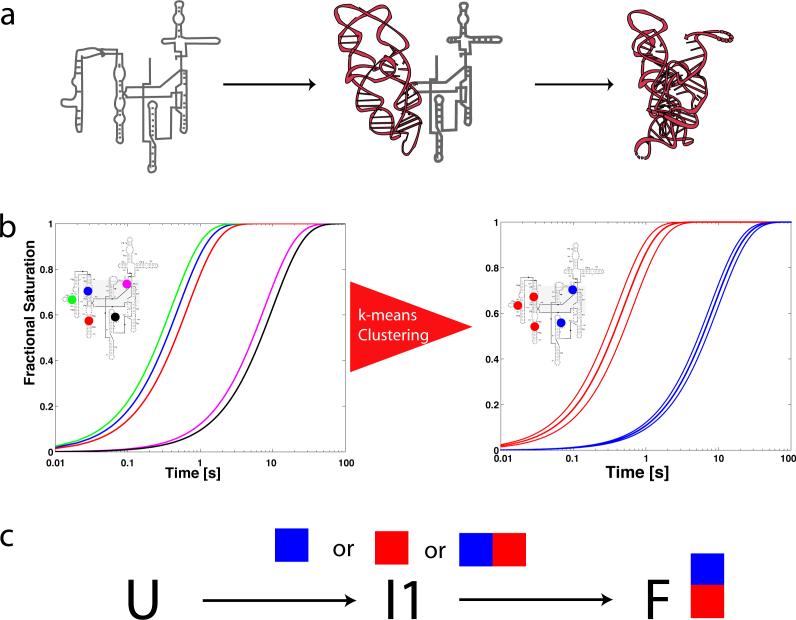
Figure 1.
Illustration of the effect of intermediates on progress curves for local probes of macromolecular structure. a) In this example a single intermediate is present along the folding pathway of the molecule, in which the brown (P4-P6) domain folds first. b) If five sites on the molecule were monitored with •OH footprinting (in this case colored blue, green, red, magenta and black) one would observe heterogeneous progress curves. The thick lines in the right hand plot indicate average time-progress curves based on a k-means clustering of the data. c) Once the data are clustered the problem of reconstructing the kinetic model that best fits the data is solved by exhaustively fitting all possible mappings of intermediates to progress curves. In this very simple case, three mappings must be tested (blue curve to I1, red curve to I1, or blue and red curve to I1).

