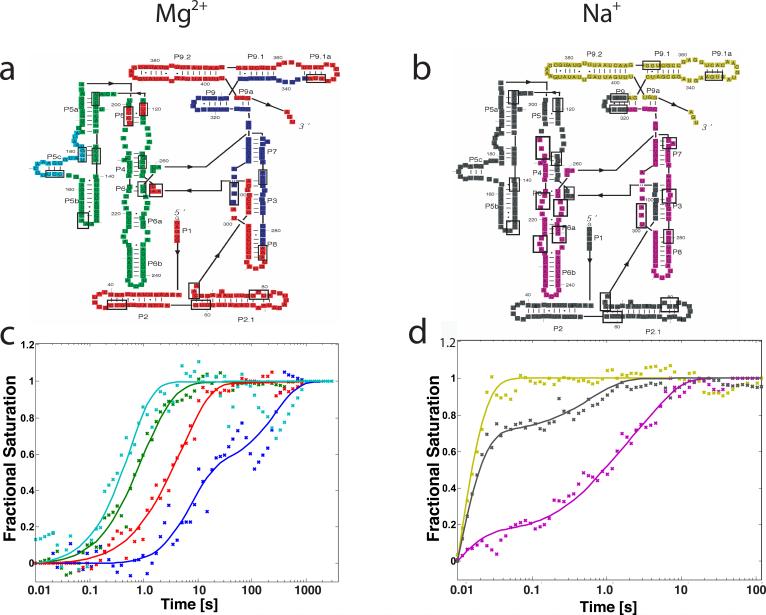
Figure 2.
a) and b) Colored secondary structure diagram representation of the L-21 T. thermophila group I intron. Colors represent regions of molecule exhibiting similar time-progress curves during folding in the Mg2+ and Na+ mediated folding, as determined by k-means clustering of site-specific progress curves. Boxes indicate sites of protection that were monitored on the molecule, these are also listed in the Supplementary Material. c) and d) Best fitting kinetic model predictions (lines) to time-progress curves for the Mg2+ and Na+ mediated folding, respectively. Fractional saturation calculated based on hydroxyl radical footprinting protection data is plotted with × symbols. Colors correspond to the different regions of the molecule as defined in a) and b).

