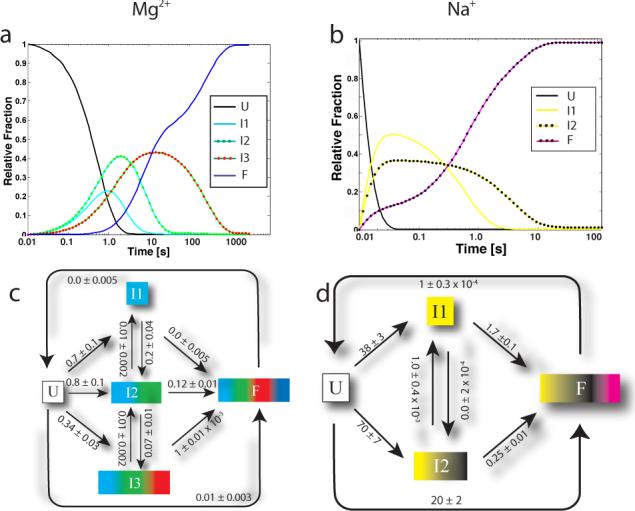
Figure 3.

a) and b) Time-evolution of the different species in solution for Mg2+ and Na+ mediated folding, respectively. c) and d) Best fitting kinetic model diagrams for Mg2+ and Na+ mediated folding, respectively (rate constants are in s−1). Errors on the kinetic parameters were computed using a bootstrap procedure and can also be found in the Supplementary Material. Reverse rates were constrained to zero as an equivalently good fit to the data was obtained with and without these constraints. The I1→I3 rate is not shown for clarity but is 0.3±0.02 s−1. All other rates not shown are ≤0.01 s−1 and are reported in the Supplementary Material Tables.
