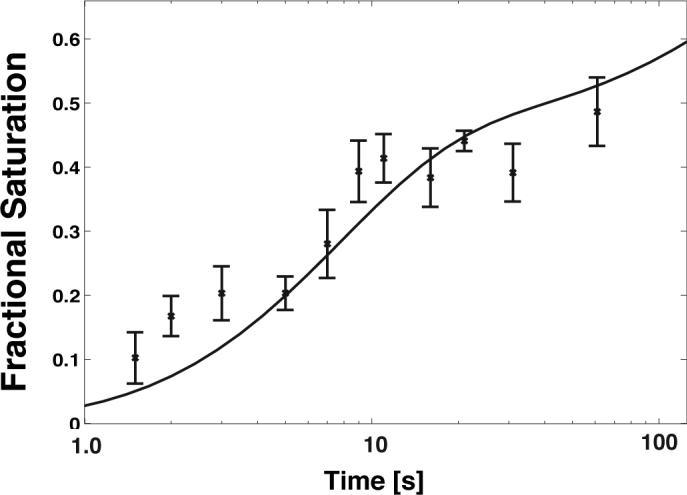
Figure 5.

Catalytic activity measurements (×) for the T. thermophila group I intron as measured from the amplitude of burst phase in multiple turnover experiments. The black line is the predicted evolution of the folded species (F) based on the kinetic model depicted in Figure 3c. Error bars represent three standard deviations based on three repeats of the experiment.
