
Figure 5.
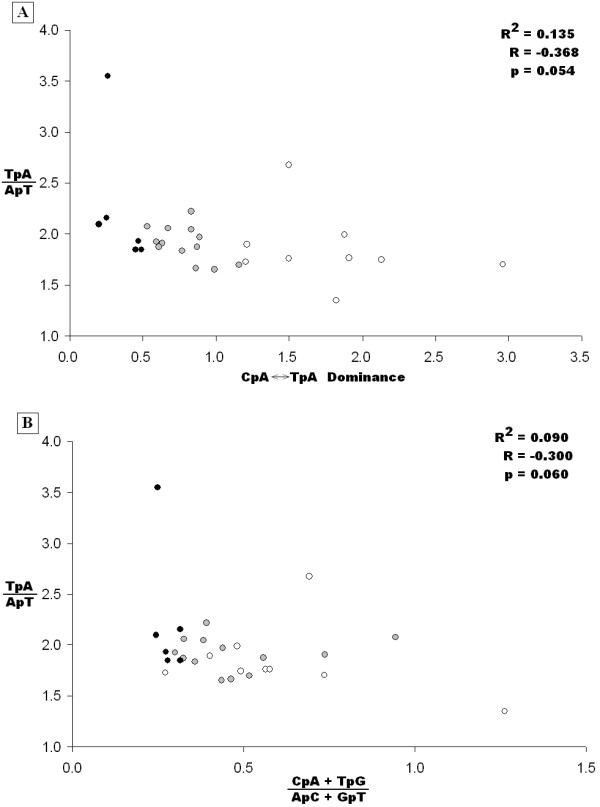
Comparison of RIP indices with alignment-based RIPCAL comparisons for repeat families of Stagonospora nodorum. A) Comparison of TpA/ApT RIP index with the alignment-based CpA↔TpA dominance. A positive correlation was expected however was not observed. B) Comparison of the TpA/ApT and (CpA+TpG)/(ApC+GpT) RIP indices. A negative correlation would be expected. Repeat families exhibiting low levels of RIP by alignment based analysis are represented by black dots (CpA↔TpA dominance < 0.5); medium families are grey (0.5 ≤ CpA↔TpA dominance ≥ 1.2); and high are white (CpA↔TpA dominance > 1.2).