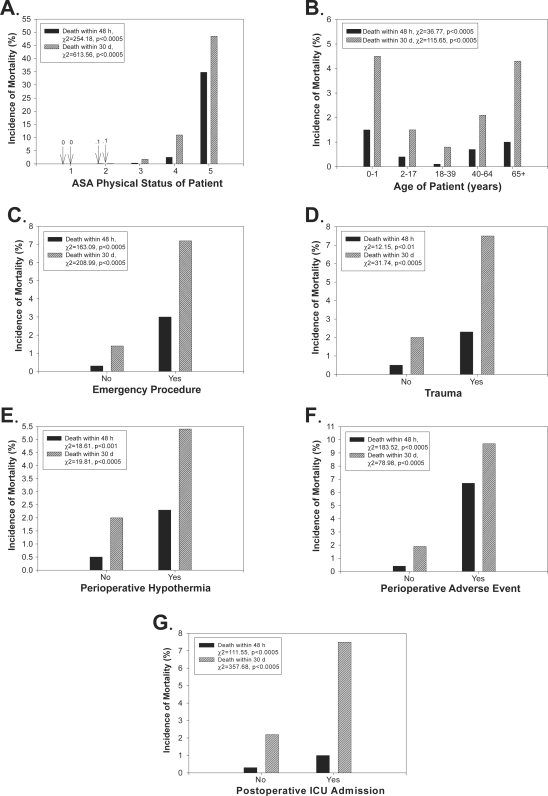
Figure 1.
Risk factors for 48 h and 30 d postoperative mortality. For each panel, the y-axis shows the incidence of mortality (%) 48 h or 30 d postoperatively, and the x-axis shows the ASA PS of the patient (A; 1–5 scale), the patient’s age (B; years), the emergency status of the operation (C), whether the operation was a trauma case (D), whether the patient was hypothermic perioperatively (E), whether a perioperative adverse event occurred (F), and whether the operation resulted in postoperative intensive care unit admission (G). In some panels, the exact percentage is noted with an arrow (eg, “0” refers to “0%”).
Notes: The figure legends list the significance levels from chi-square or Fisher’s exact test examining incidence rates across each level of the risk factor.
Abbreviations: ASA PS, American Society of Anesthesiologists physical status; d, day; h, hour; NS, not significant.

