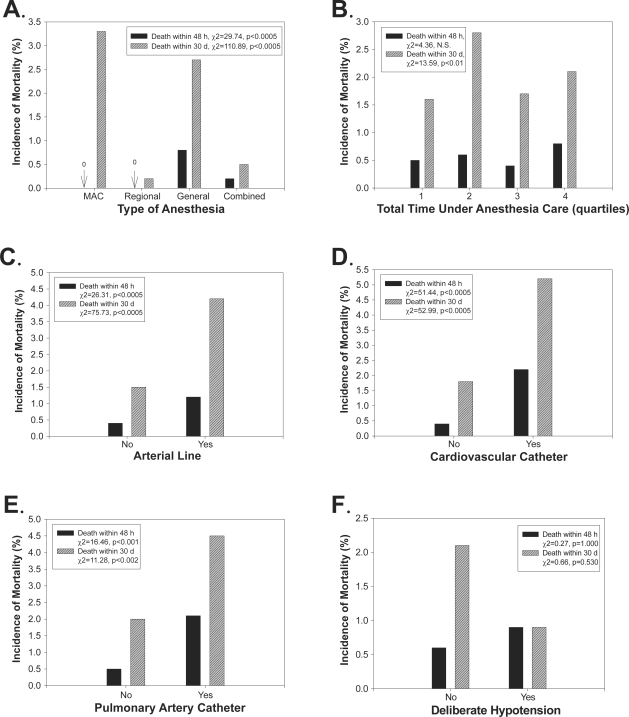
Figure 2.
Risk factors for 48 h and 30 d postoperative mortality. For each panel, the y-axis shows the incidence of mortality (%) 48 h or 30 d postoperatively, and the x-axis shows the anesthesia type (A; MAC, regional anesthesia, general anesthesia or combined), the total time under anesthesia care (B; minutes), the use of invasive monitoring via arterial line (C), cardiovascular catheter (D) or pulmonary artery catheter (E), and whether the operation involved deliberate intraoperative hypotension (F). In some panels, the exact percentage is noted with an arrow (eg, “0” refers to “0%”).
Notes: The figure legends list the significance levels from chi-square or Fisher’s exact test examining incidence rates across each level of the risk factor.
Abbreviations: d, day; h, hour; MAC, monitored anesthesia care; NS, not significant.

