
Figure 4.
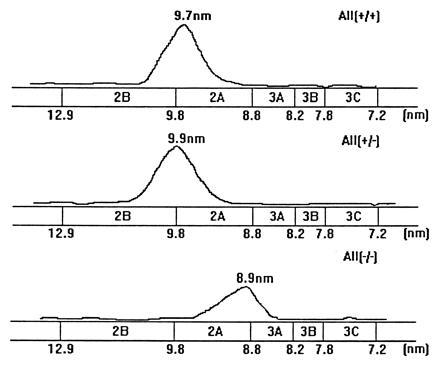
The distribution of HDL particle size diameters. HDL was isolated by sequential ultracentrifugation, and HDL from equal amount of plasma was subjected onto nondenaturing gradient gel electrophoresis (4–20% gradient). The gel was then stained and scanned by LKB Laser Densitomer. +/+. +/−, and −/− represent control littermates, heterozygous apo A-II-deficient mice, and homozygous apo A-II-deficient mice, respectively.