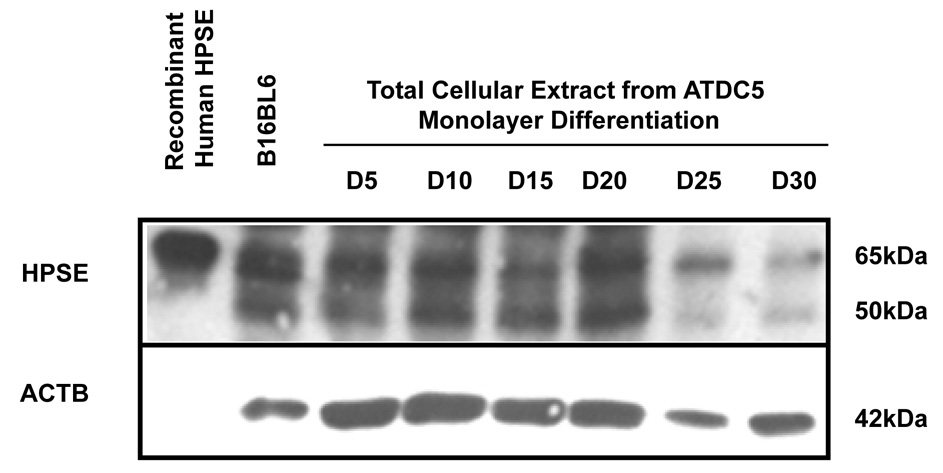
Figure 4. HPSE expression peaks as ATDC5 cells approach terminal differentiation.
Total protein was extracted from differentiated ATDC5 cells at various time points and assayed for HPSE expression. Although, HPSE is not abundant in ATDC5 cells, there is an increase in HPSE expression as ATDC5 cells progress through chondrogenic differentiation. ATDC5 cells were submitted to chondrocytic using culture conditions as described in “Materials and Methods.” To determine protein expression, total cellular extract was electrophoresed, transferred, and immunoblotted using anti-heparanase polyclonal antibody 1453. The proform of HPSE is detected at 65kDa, and the enzymatically active form is detected at 50kDa. The proform was detected at high levels from D5 to D20 of chondrogenic differentiation, however, expression decreased at D25 and D30 of culture. The enzymatic form was initially detected at D5 and expression levels increased up until D20. At D25 and D30 there was little to no detection of the enzymatic form. Recombinant human HPSE and total cellular extract from B16BL6 cells, mouse melanoma cell line, was used as a positive control. Equivalent loading was confirmed by immunblotting with anti- ACTB. HPSE intensity was quantified as described in the “Materials and Methods.” Normalizing expression to ACTB indicates an increase in HPSE expression as the cells differentiate.

