
Figure 2.
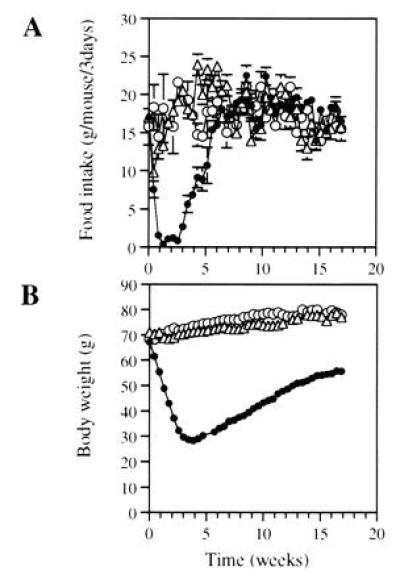
Reduction of food intake (A) and body weight (B) in ob/ob mice after leptin gene administration. The ob/ob mice were injected with either Ad.RSV-mLeptin (•) or Ad.RSV-hAAT (▵) at 3 × 10⁹ pfu per mouse or PBS only (○). The mice were caged individually. Food intake and body weight were measured every 3 days. Food intake data are expressed as number of grams consumed every 3 days. All points represent the mean ± SEM of seven mice (some error bars are hidden within symbols).