
Figure 1.
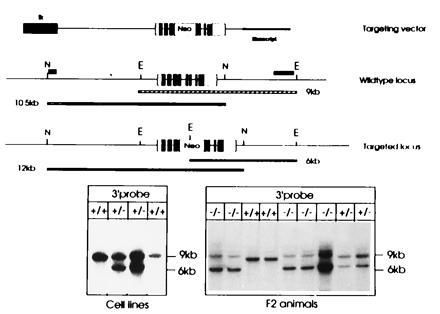
Structure of the targeting vector and the targeted ASA locus. The structure of the linearized replacement vector is shown on top. The ASA gene is indicated by boxes, open parts are 5′ or 3′ untranslated regions, and solid parts depict coding sequences. The tk gene at the 5′ end is shown as a hatched box; the Bluescript plasmid vector is indicated by a bold line. The wild-type locus is shown below, N and E indicate NsiI and EcoRI sites, respectively. The position of external probes used to detect the targeted locus is shown at the 5′ and 3′ end. Size of the fragments (9 and 10.5 kb) hybridizing to these probes is indicated by the bars below. The third schematic drawing depicts the homologously recombined locus and the altered size of the DNA fragments detected by the 5′ and 3′ probe. Southern Blot analysis of DNA isolated from ES cells (Left) and tail tips of F2 animals (Right) are shown at the bottom. EcoRI-digested DNA was hybridized to the 3′ external probe. The size of fragments is indicated on the right. Genotypes are shown on top. This analysis was frequently complicated by the presence of an additional fragment slightly larger than the 9-kb fragment indicative of the wild-type locus. This fragment is most likely due to partial digestion as can be concluded from the varying intensities of this fragment in comparison to the 6-kb fragment in the homozygous −/− mice. Blots of NsiI-digested DNA hybridized with the 5′ probe are not shown.