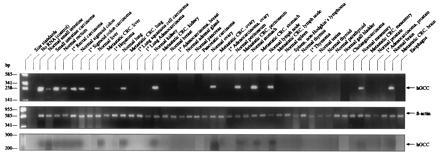
Figure 1.

Expression of GCC in tissues detected by RT-PCR. (Top and Middle) RT-PCR was performed employing mRNA purified from indicated tissues and primers for GCC (Top) or β-actin (control; Middle), as described. (Bottom) Aliquots of the above RT-PCRs were subjected to the ribonuclease protection assay as described. Left lane indicates size markers. Arrows indicate the size of human GCC (hGCC; ≈250 bp) and β-actin (≈600 bp) predicted from their defined sequences.
