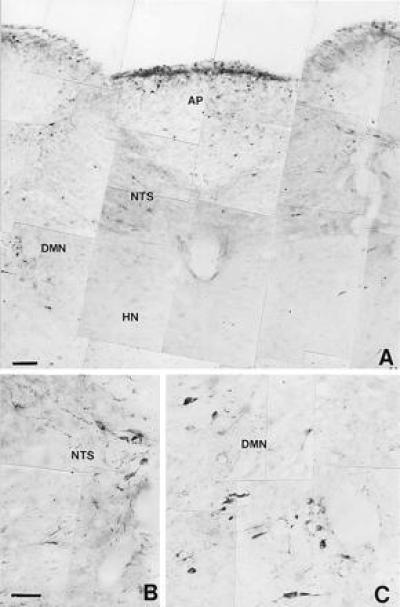
Figure 8.

Microphotograph showing nNOS immunoreactive neural structures distributed in the most rostral portion of the medulla oblongata (A) from a control rat. HN, hypoglossal nucleus. (B and C) Large magnification of immunoreactive neurons in the NTS and the DMN, respectively. (Bars = 0.005 mm.)
