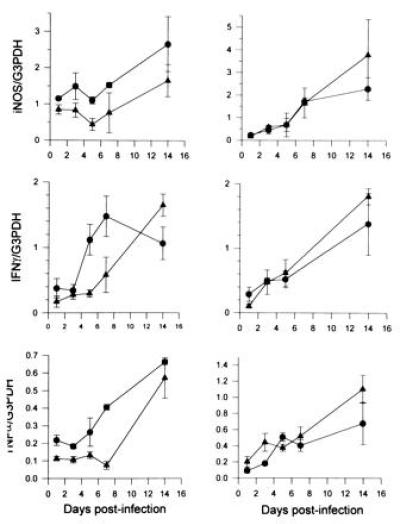
Figure 6.

Assessment of the expression of iNOS (Top), IFN-γ (Middle), and TNF-α (Bottom) in the lungs (Left) and liver (Right) of M. tuberculosis-infected CD1 mice given a 2% (▴) or a 20% (•) protein diet demonstrates selective attenuation of expression of these three elements in the pulmonic tissues of malnourished animals. Three mice per group per time point were studied. Error bars represent standard error.
