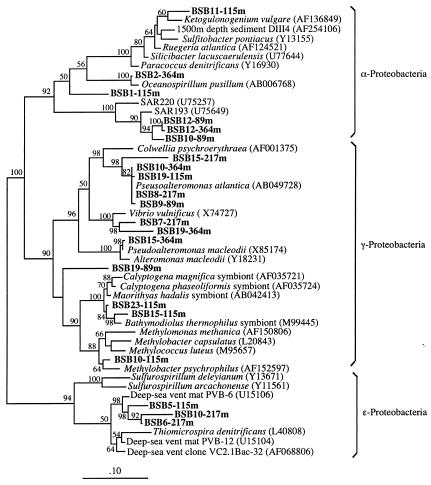
FIG. 2.
Phylogenetic analysis of the proteobacteria from the Black Sea using maximum likelihood. The scale bar represents the expected number of changes per sequence position. Black Sea bacteria (in boldface) are indicated by BSB followed by the phylotype number and the depth interval from which the specific phylotype was obtained. The numbers depict bootstrap values obtained for a bootstrap sampling of 100.

