
FIG. 1.
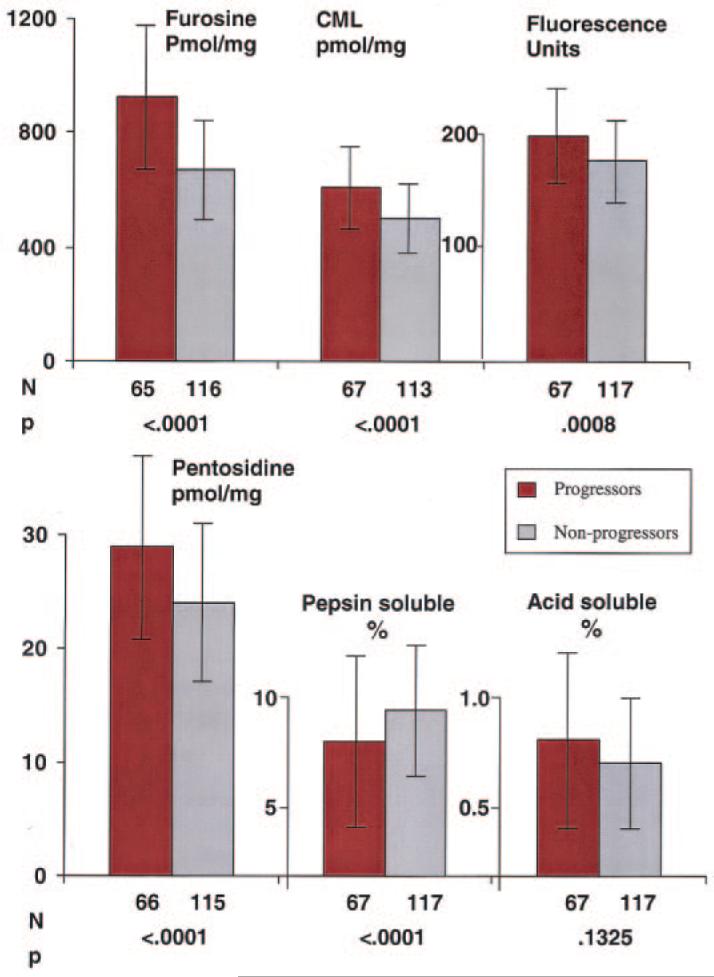
Distribution of skin collagens by retinopathy progression status. The mean and SD of each skin collagen parameter are compared in those participants whose retinopathy progressed (red bars) three or more steps on the Early Treatment of Diabetic Retinopathy Scale scale and/or required retinal photocoagulation between the end of the DCCT and year 10 of EDIC versus those whose retinopathy did not progress ( ). All values are adjusted for age and diabetes duration at the time of the biopsy.