
FIG. 3.
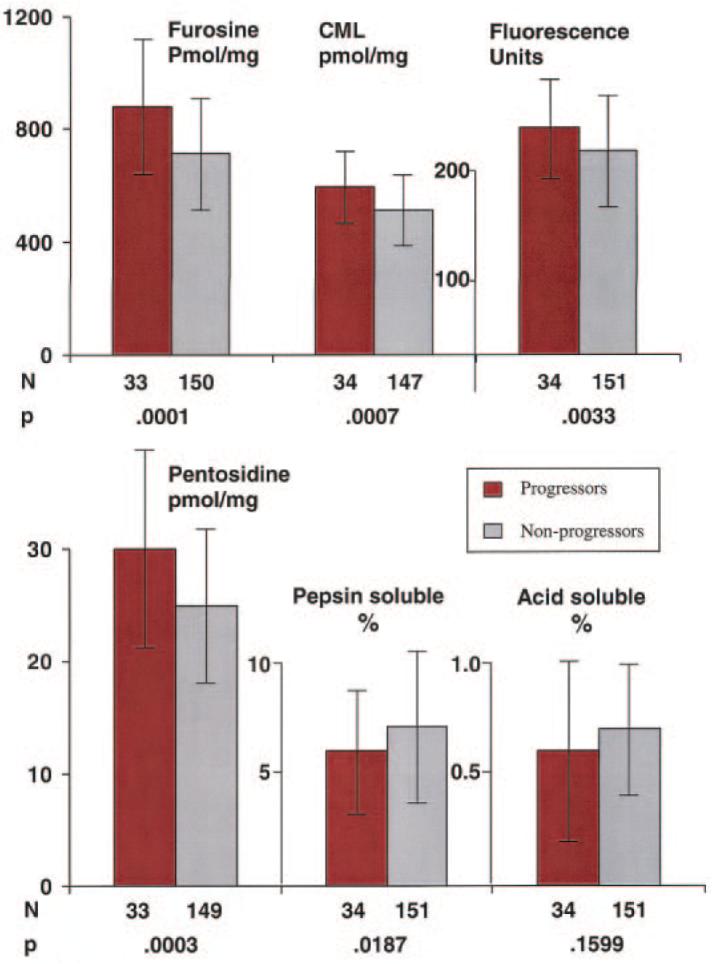
Distribution of skin collagens by nephropathy progression status. The mean and SD of each skin collagen parameter are compared in those participants who developed microalbuminuria or worse (red bars) between the end of the DCCT and EDIC year 9–10 versus those who did not develop microalbuminuria ( ). All values are adjusted for age and diabetes duration at the time of the biopsy.