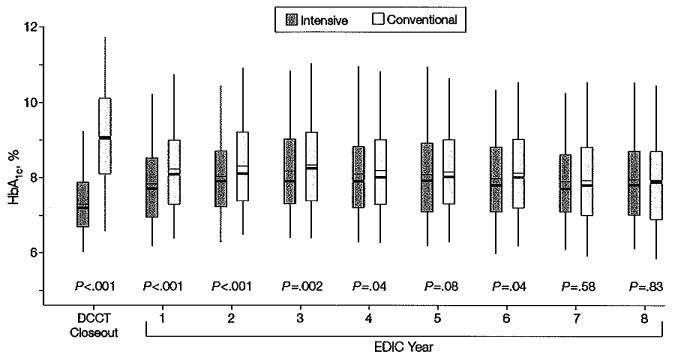
Figure 1.
Distribution of HbA1c Concentration by Randomized Treatment Group at the End of the DCCT and in Each Year of the EDlC Study
DCCT indicates Diabetes Control and Complications Trial; EDIC, Epidemiology of Diabetes Interventions and Complications; HbA1c, glycosylated hemoglobin. Boxes indicate 25th and 75th percentiles of HbA1c, level; whiskers, 5th and 95th percentiles; heavy horizontal lines, medians; thin horizontal lines, means.

