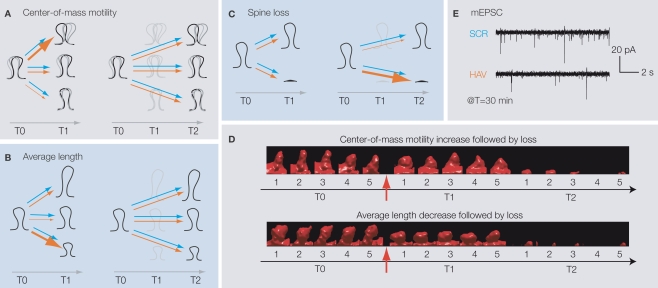
Figure 2.
(A) HAV-treated spines are more likely than control spines to show an increase in center-of-mass motility (fast timescale, positional dynamics) at T1, but not at T2. Thicker arrows indicate a greater likelihood of the behavior. Blue and red arrows indicate control and HAV treatments, respectively. T0 (baseline) = −10 min, T1 = 75 min, and T2 = 180 min. (B) HAV-treated spines are more likely than control spines to show a decrease in average length (slow timescale, length dynamics) at T1, but not at T2. (C) Greater loss of HAV-treated spines at T2. (D) After HAV treatment, spines that show an increase in motility or a decrease in length at T1 are more preferentially lost at T2. (E) At T = 30 min after treatment, there are far fewer miniature excitatory postsynaptic currents (mEPSCs) than in control. All panels derived from Mysore et al. (2007).

