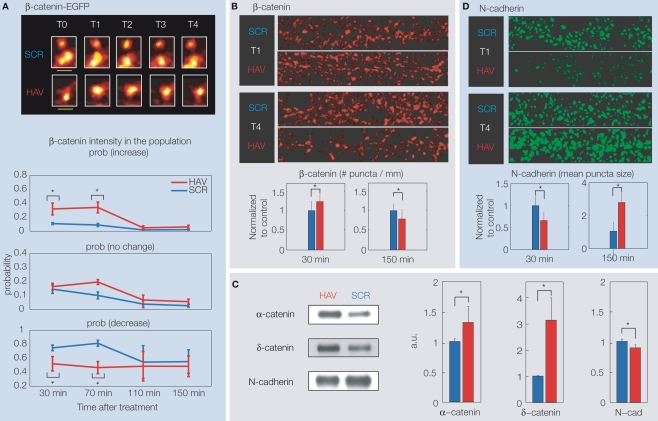
Figure 3.
(A) Top panel: Example spine images showing the intensity of over-expressed β-catenin-EGFP after HAV or control treatment (at T = 0 min). T0 (baseline) = −10 min, T1 = 30 min, T2 = 70 min, T3 = 110 min, T4 = 150 min. The pseudocolor maps maximum intensity to white and minimum to black. Bottom panel: Summary data showing the probability at each timepoint of increase, decrease or no change in spine β-catenin with respect to the level at T0 = −5 min. (B) Example images of dendrites stained for endogenous β-catenin at T1 and T2, and summary data, showing a treatment-induced increase at T1 and a decrease at T2 in # β-catenin puncta per micrometer. A fluorescent secondary is used against a primary antibody to β-catenin, and the images are analyzed in 3D to determine puncta properties (Tai et al., 2007). (C) Results of immunoprecipitation of β-catenin at T1 (30 min) followed by probing for α-catenin, δ-catenin, and N-cadherin. Examples and summary data show an increase in binding of β-catenin to α-catenin and δ-catenin, but a decrease in binding to N-cadherin. (D) Example images of dendrites stained for endogenous surface N-catenin at T1 and T2, and summary data, showing a treatment-induced decrease at T1 and increase at T2 in the size/intensity of surface N-cadherin puncta. All panels present previously unpublished data.

