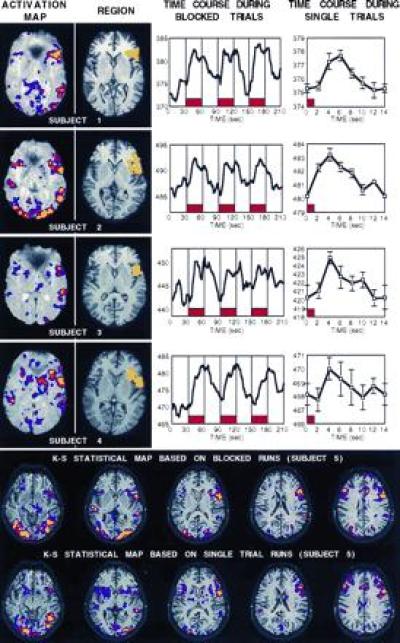
Figure 2.

(Upper) The top figure shows experiment one data for each of the four subjects. For each subject, four kinds of data are shown left to right including: an activation map (threshold = P < 0.01, red = P < 10−5, yellow = P < 10−8) plotted superimposed on top of a raw T2* weighted functional image; the region constructed to include the left inferior prefrontal activation (yellow) on top of a T1-weighted echo planar image showing more detailed anatomy; the region’s mean MR signal intensity during the runs with blocked trials of word-stem completion (placement of blocks shown in red, time course smoothed to three time points); and the region’s mean MR signal intensity during the single-trial runs (placement of trial shown in red, time point at 0 sec duplicated at time point 14 sec to show continuation of trial, no temporal smoothing, plus standard error of the mean). (Lower) K-S activation maps are shown for all slices collected in subject 5, plotted on top of the T1-weighted images (threshold lowered to P < 0.05 to allow more complete comparison, red = P < 10−4). Top activation map shows data derived from the blocked runs while the bottom map shows data derived solely from the single-trial runs. The two maps overlap considerably.
