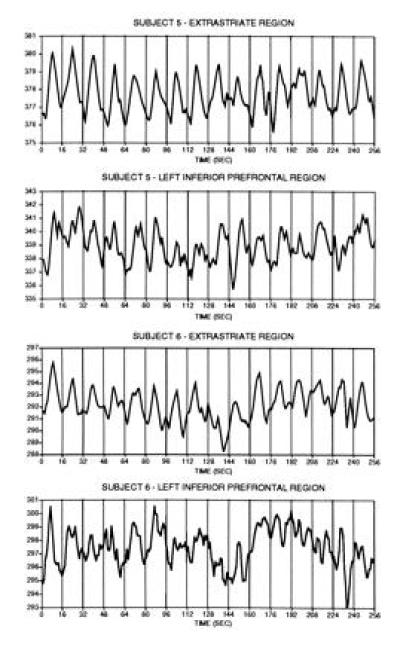
Figure 3.

Time-course data from the extended single-trial runs in experiment two are shown for each subject (eight runs averaged per subject, see text). Data from each run comprise the mean MR signal magnitude within the individual regions indicated (separate data are shown for extrastriate and left inferior prefrontal regions). Each vertical line represents the start of a trial, each of which was spaced 16 sec apart. Clear signal changes in relation to the 16 temporally separate trials can be observed and most clearly for the extrastriate regions. Single-trial responses were more robust in the earlier trials as compared with the later trials. These signal changes were averaged to produce the time-course data presented in Fig. 4.
