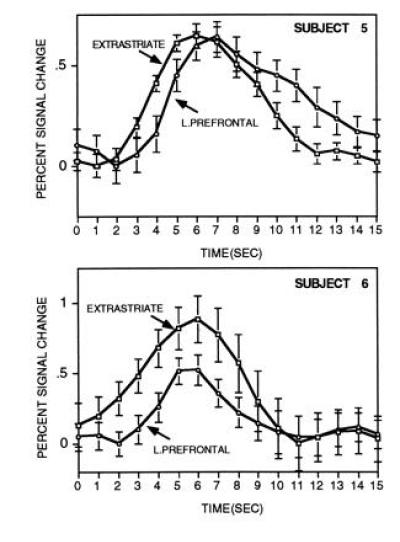
Figure 4.

The time course for averaged single-trial responses are shown for separate brain regions in experiment two (plus standard error of the mean). Both regions come from the same slice and were selected based on data from the blocked runs. Each time course comprises the average of 128 individual trials and is plotted in relation to percent signal change to make the comparison across brain regions. Time-course data are smoothed across adjacent time points. As can be seen, robust signal increases occur starting at about two sec after the onset of the stimulus (0 sec) and continue for about 10 sec. The prefrontal response was delayed in relation to the extrastriate response in both subjects.
