
Figure 3.
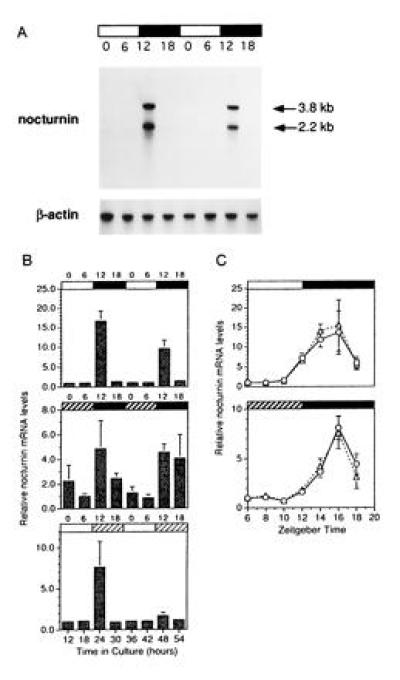
Expression patterns of nocturnin mRNA. Xenopus eyecups were cultured in cyclic light, constant darkness, or constant light. At the times indicated, retinas were isolated and RNA was prepared. Nocturnin mRNA levels were measured from individual retinas by Northern blot analyses, followed by quantitation by phosphorimaging. RNA levels are represented as “fold changes” over the first time point within each experiment (ZT 0 in B and ZT 6 in C). The absolute value of the “fold change” between different experiments cannot be directly compared. These quantitations are meant to illustrate the overall temporal pattern of expression of the message and the amount of variability between retinas, rather than to measure absolute levels of message. (A) Example of a Northern blot detection of nocturnin mRNA from retinas collected at 6-hr intervals over two days in cyclic light. Each lane contains about 1 μg of total RNA from a single retina. Bars above the blot indicate the lighting conditions: black bars indicate night (dark) and white bars indicate day (light). Numbers above the lanes denote ZT in hours, in which ZT 0 is defined as the time of normal light onset (dawn) and ZT 12 is defined as time of normal dark onset (dusk). The blot was stripped and reprobed with a chicken β-actin probe (29) for normalization of the lanes. (B) Quantitation of nocturnin mRNA levels at 6-hr intervals over two days in cyclic light (Top), constant dark (Middle), or constant light (Bottom). Numbers above the graphs indicate time of harvest (ZT). Bars above each graph denote lighting conditions at time of harvest. Bars: □, light in subjective day; ▪, dark in subjective night; , dark in subjective day; and ▨, light in subjective night. Each time point shown is an average of measurements of both the 3.8-kb and 2.2-kb messages from four or five individual retinas. Error bars = SEM. (C) Quantitation of nocturnin mRNA levels at two hr intervals from mid-day (ZT6) to mid-night (ZT18) in cyclic light (Upper) and constant dark (Lower). The two lineson the graphs represent the two different nocturnin mRNA species, which were quantitated separately; the triangles represent the 2.2-kb message, the circles represent the 3.8-kb message. The bars above the graphs indicate lighting conditions at the time of harvest as described in B. Each point represents measurements of nocturnin message levels from four to five individual retinas. Error bars = SEM.