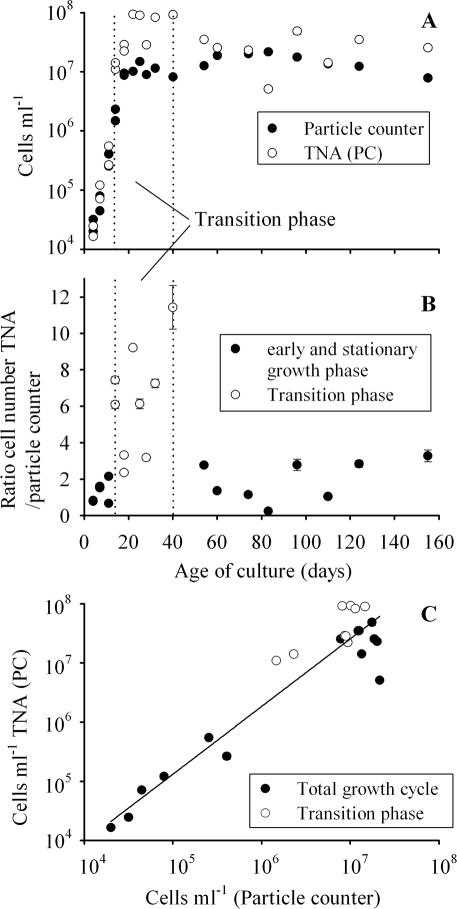
FIG. 2.
(A) Cell numbers of Microcystis HUB524 grown under high-light conditions in batch culture and quantified via electronic particle counting and TNA over 4 months (mean ± 1 standard error). Data are from two independent batch culture experiments. For reasons of clarity, only the cell numbers quantified with the PC gene are shown; for details on statistical correlation between cell numbers and both the PC gene and mcyB, see the text. The region within the dotted lines is considered the transition phase from logarithmic growth to the stationary phase. (B) Ratio of cell numbers determined by TNA to cell numbers determined by the particle counter during the same batch culture experiment (mean ± 1 standard error). The transition from the exponential growth phase to the stationary phase differed significantly (P < 0.001, Mann-Whitney rank sum test) from the earlier and later growth phases. (C) Regression of cell numbers (mean ± 1 standard error) determined by the TNA (PC operon) versus cell numbers determined by the electronic particle counter during the same batch culture experiment. Error bars that are not visible are hidden behind the symbols.

