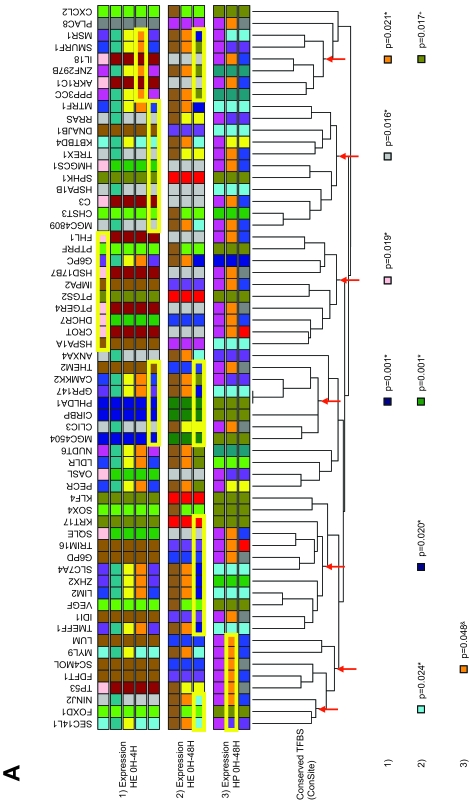
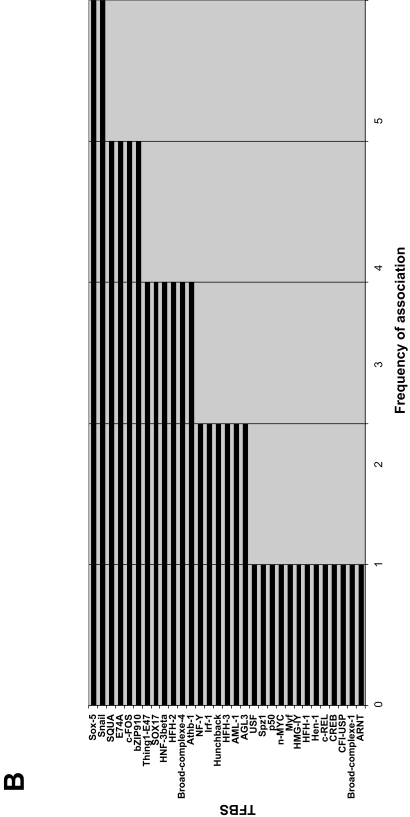
Figure 5. Hierarchical clustering of ETV6-modulated genes by conserved putative TFBSs found in their promoter and associations with expression groups.
A. A hierarchical tree of ETV6-modulated genes was constructed based on conserved putative TFBSs found in their promoter using ConSite. Coloured squares below gene symbols identify the expression group of the corresponding gene as determined by hierarchical clustering in Figure 2: 1) Pearson correlation distances at 0 h, 4 h, 12 h and 48 h (HP 0 h–48 h) (Fig. 2A); 2) Euclidean distances at 0 h, 4 h, 12 h and 48 h (HE 0 h–48 h) (Fig. 2B) and; 3) Euclidean distances at 0h and 4h (HE 0 h–4 h) (Fig. 2C). Expression groups are shown in several rows to represent all the possible group sub-divisions: the bottom row of squares shows the colours that assign each gene to its smallest expression group (colours just below the gene symbols in Fig. 2) and the rows above show the colours assigned to each gene after some close expression groups have been merged (e.g. grey, blue, red and green in Fig. 2A are merged in a larger orange branch). Values at the bottom are Fisher’s exact p-values assigned to the node marked by the arrow on the branch above and the expression clustering methods are indicated on the left (numbers). The colour assigned to the p-value is indicative of the group that is over-represented in the branch. The yellow rectangles around the coloured squares delineate the genes that belong to a node where a significant over-representation is observed. B. Terms involved in the associations were counted and plotted by frequency of occurrence FDR correction for multiple testing: *: significant when FDR = 5%; +: significant when FDR = 10%; &: significant when FDR = 15%.


