Figure 3.

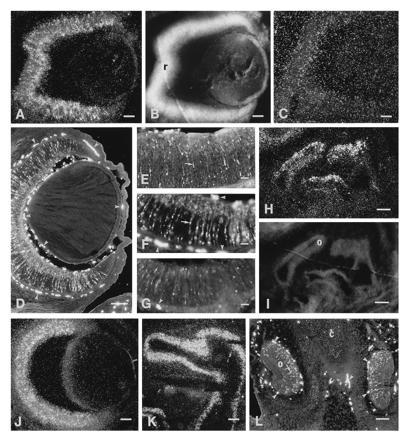
Darkfield (A, C, H, J, and K) and fluorescence (D–G and L) micrographs of the eye (A–G and J) and nasal mucosa (H and K–L) showing ppGAL mRNA (A, H, J, and K) GAL-R1 mRNA (C) and GMAP-LI (D–G and L) expression. B and I show bisbenzimide counterstaining of the same sections as in A and H, respectively. GAL expression (arrows) is seen in the retina (r), with the highest level at E17 (A, D, and F) and lower levels at E15 (E) and E19 (G and J). No distinct GAL-R1 mRNA signal is seen at E17 (C). A strong ppGAL mRNA signal is seen in the dorsal aspects of the nasal mucosa at E15 (H) and E21 (K). GMAP-LI (arrow) is seen in olfactory epithelium (o) (L). c, cartilage. Small arrowheads indicate nonspecific staining. (A–G, J, and K, bar = 100 μm; H, I, and L, bar = 200 μm.)
