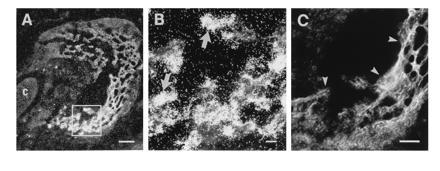
Figure 4.

In situ hybridization autoradiographs of bone formation (A and B). B is a high magnification of A, as indicated by small box. C shows bisbenzimide counterstaining of part of the section shown in A. A strong ppGAL mRNA signal (arrows) is seen in cellular elements (arrowheads) in the zone of bone formation. c, Cartilage. (A, bar = 200 μm; B and C, bar = 50 μm.)
