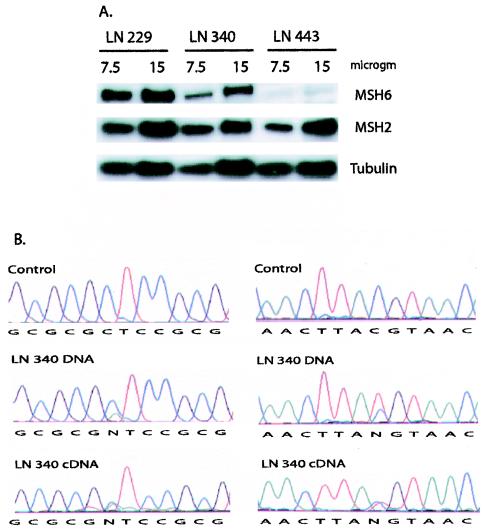
FIG. 8.
Analysis of MSH6 expression in glioblastoma cell lines. (A) Western blot analysis of MSH6, MSH2, and tubulin expression. Cell extracts were prepared from the LN229, LN340, and LN443 and analyzed by Western blotting as described in Materials and Methods. Portions (7.5 and 15 μg) of each extract were analyzed as indicated above the individual lanes. The MSH6, MSH2, and tubulin bands are indicated on the right side of the gel. (B) Sequence analysis of MSH6 mRNA expression from the five and seven Sp1 site promoters. Genomic DNA and cDNA from LN340 cells were prepared and sequenced as described in Materials and Methods. LN340 cells are heterozygous for two different MSH6 alleles: one allele is the seven Sp1 site promoter allele −557G −448G −159C 186A (exon 1) 642C (exon 4), and the other allele is the five Sp1 site promoter allele −557G −448A −159T 186C (exon 1) 642T (exon 4). The sequences on the left cover the region around nucleotide 186 from a control (186C) DNA and LN340 genomic and cDNA as indicated. The sequences on the right cover the region around nucleotide 642 from a control (642C) DNA and LN340 genomic and cDNA as indicated. Reduction of the relative levels of the 186C and 642T nucleotides linked to the five Sp1 site promoter compared to the levels of the 186A and 642C nucleotides linked to the seven Sp1 site promoter is seen in the cDNA relative to the genomic DNA.

