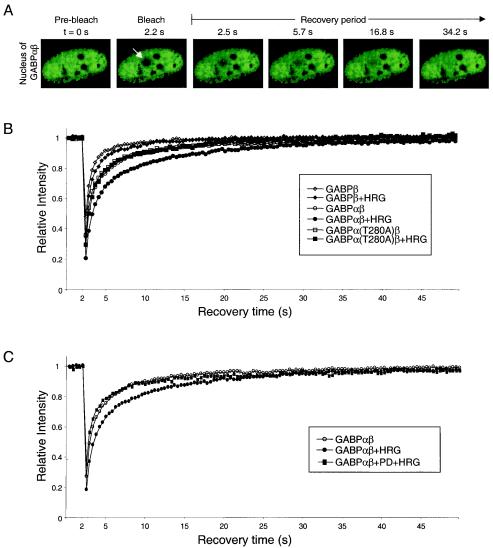
FIG. 5.
FRAP analysis of the mobilities of GABP proteins upon HRG stimulation. (A) C2C12 myotubes expressing EGFP-GABPα and nontagged GABPβ were bleached at 2.2 s in the region indicated by the arrow. Images were taken before bleaching and after bleaching with an interval of 0.3-s. Only selected images from the recovery period are shown. (B) FRAP analysis of living cells expressing GABPβ, GABPαβ, and GABPα(T280A)β either mock treated or treated with HRG. (C) FRAP analysis of living cells expressing GABPαβ either mock treated, treated with HRG, or treated with HRG in the presence of PD. Quantitative data of fluorescence recovery kinetics are plotted. Fluorescence intensities in the bleached region were measured and expressed as the relative recovery over time after the bleach pulse. The relative intensity is shown as the average from ≥3 independent experiments with ≥6 individual cells per experiment. Standard deviations were in each case less than 5% of the average value (not shown).

