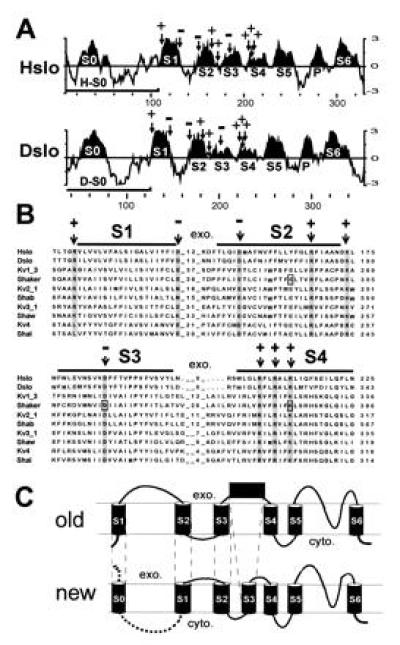
Figure 1.

Unique hydrophobic region at the N terminus of MaxiK channels. (A) Kyte–Doolittle hydrophobicity plot (26) of Hslo and Dslo from the N terminus to the end of region S6. The curve represents the average of a residue-specific hydrophobicity index calculated from a window of 9 amino acids. Hydrophobic regions S1–S6 (and the pore region P) were designated according to the multiple sequence alignment (Fig. 2B) and are highlighted. Arrows mark the positions of conserved charged amino acids. Bars denote the coding region of clones H-S0 and D-S0. (B) Part of a multiple sequence alignment of Hslo and Dslo with voltage dependent potassium channels. The numbers between hydrophobic regions represent the number of amino acids of extracellular loops. The abundance of hydrophobic residues throughout the alignment and the hydrophobicity analysis of Hslo and Dslo were considered for designating transmembrane regions (marked with bars). Conserved amino acids are shaded and conserved charged amino acids are marked with an arrow. (C) Comparison of the previously suggested model (old) with the topology suggested to us by the sequence homology and hydrophobicity analysis (new). The exoplasmic (exo.) and cytoplasmic (cyto.) sides of the membrane are marked.
