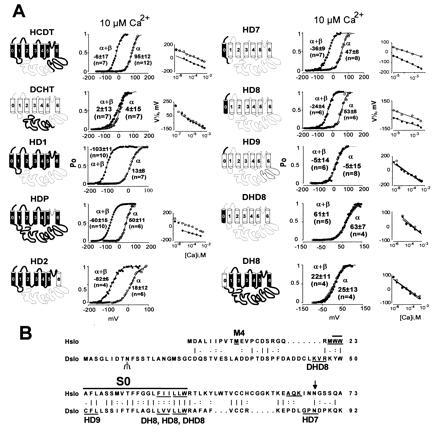
Figure 5.

Transfer of β-subunit modulation from Hslo to Dslo. (A) Thick lines and solid membrane-spanning regions indicate sequences derived from Hslo; thin lines and open membrane regions are sequences derived from Dslo. Open probabilities in 10 μM Ca2+ for a representative experiment are plotted against voltage. Values are the mean half-activation potentials at 10 μM Ca2+ (±SD, n = number of experiments). V½ vs. Ca2+ are also shown. Oocytes were injected with 5 ng of α-subunit and 10 ng of β-subunit cRNA. Titration studies showed that even 10-fold less β-subunit cRNA is a saturating concentration (data not shown). (B) Sequence comparison of the N-terminal region of Hslo and Dslo. Hydrophobic region S0 is marked with a bar. Three amino acids at the junctions of chimeric constructs are underlined. M4 marks the beginning of clone Hslo-M4. The N-linked glycosylation site in Dslo is indicated with a Ψ and a consensus sequence for N-linked glycosylation in Hslo is indicated by an arrow. A vertical line, colon, and period indicate identical, highly conserved, and conserved amino acids according to the sequence comparison table of the GCG program.
