FIG. 8.
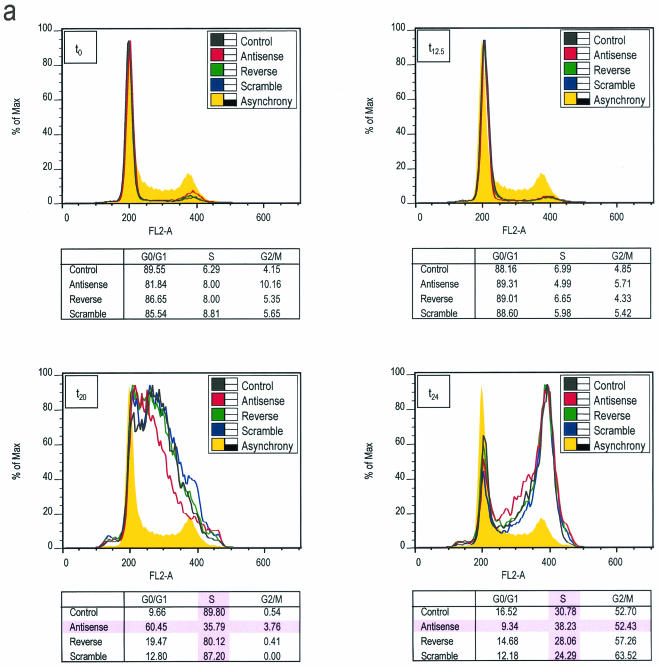
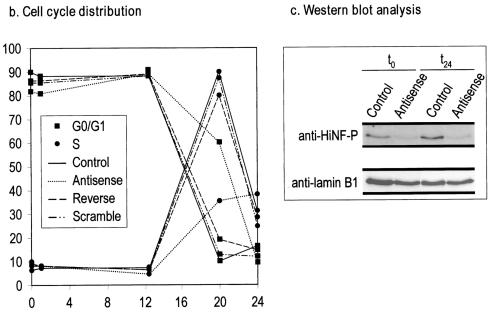
HiNF-P inhibition delays progression into S phase. (a) Analysis of cell cycle distribution by fluorescence-activated cell sorting. Fluorescence-activated cell sorting data were obtained for cells released into the cell cycle following serum stimulation. The graphs show the distribution of cells as a function of DNA content, and the tables provide a mathematical interpretation of the percentage of cells in specific cell cycle stages. (b) Graphical representation of cell cycle distribution. The fraction of cells in the G0/G1 and S phase stages as a function of time after serum addition was plotted to show an HiNF-P antisense-dependent delay in S phase progression compared to control cells. The data show that control cells reach the G1/S phase transition after 12 h. HiNF-P deficiency induced by antisense treatment decreases the S phase population with a commensurate increase in cells remaining in the G1 phase. (c) Antisense inhibition of HiNF-P. Western blot analysis of HiNF-P protein levels was performed with serum-deprived T98G cells (t0) and cells harvested 24 h after serum stimulation (t24). Lamin B1 was used as control for protein loading. Cells were treated with or without HiNF-P antisense oligonucleotide.


