
Figure 2.
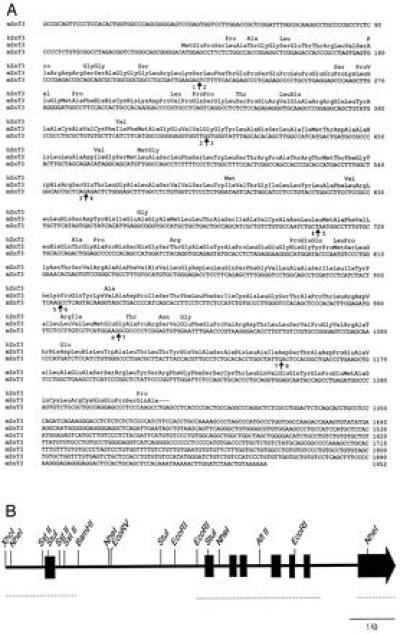
Sequence of mouse ZnT-3 cDNA, comparison of mouse and human ZnT-3 protein sequences, and mouse ZnT-3 genomic organization. (A) Mouse ZnT-3 cDNA sequence with amino acid sequence in three-letter code above. Differences between human and mouse ZnT-3 are indicated above the mouse protein sequence. Arrows indicate the location of introns and numbers designate the flanking exons. (B) A map of the mouse ZnT-3 genomic DNA showing the location of 8 exons. The regions that have been sequenced are indicated with a dotted line.