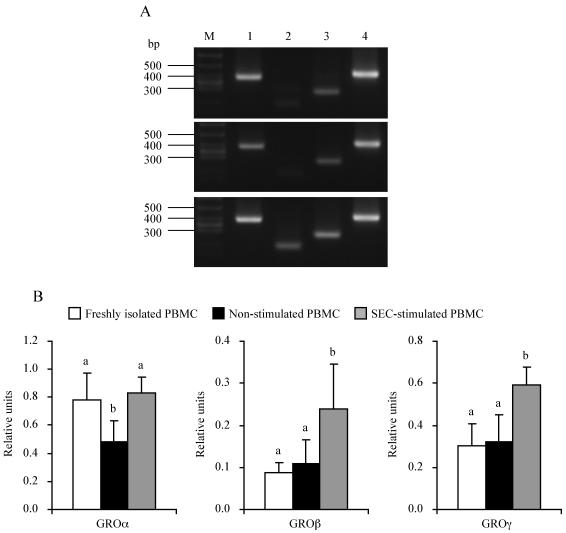
FIG. 3.
GROα, -β, and -γ mRNA levels in SEC-stimulated and nonstimulated PBMC. PBMC were cultured with or without SEC (1 μg/ml) for 2 h. GROα, -β, and -γ mRNA levels were measured by the RT-PCR method. (A) Representative amplification of RT-PCR from freshly isolated (top), nonstimulated (middle), and SEC-stimulated (bottom) PBMC. RT-PCR products were detected by electrophoresis with 3.0% agarose followed by staining with ethidium bromide. Lane M, molecular size marker; lane 1, GROα (376 bp); lane 2, GROβ (188 bp); lane 3, GROγ (268 bp); lane 4, β-actin (405 bp). (B) Relative units after normalization to the β-actin mRNA level. The results shown are means ± SD from three separate experiments. Values with different letters are significantly different (P < 0.05).

