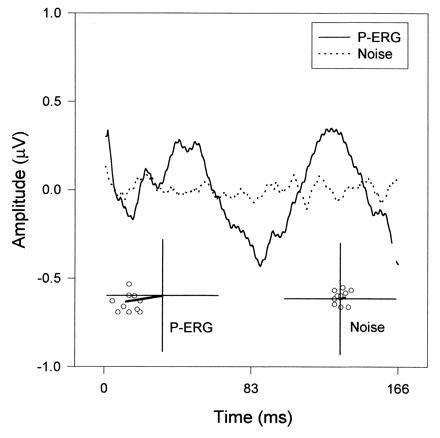
Figure 1.

Example of P-ERG (bold line waveform) in response to a 0.1 c/degree grating counterphased at 6 Hz. The superimposed dotted-line waveform represent the asynchronous noise. Note that the P-ERG has a strong modulation at twice the stimulus period (12 Hz). The polar plots represent the Fourier 12-Hz component for either waveform (vector) as well as for their partial averages (open symbols). For each estimate, the distance from origin represents amplitude (axes are calibrated to 1 μV) and the angle represents phase. Grouping of estimates indicates response reliability.
